Stocks & Options P/L TrackerOverview:
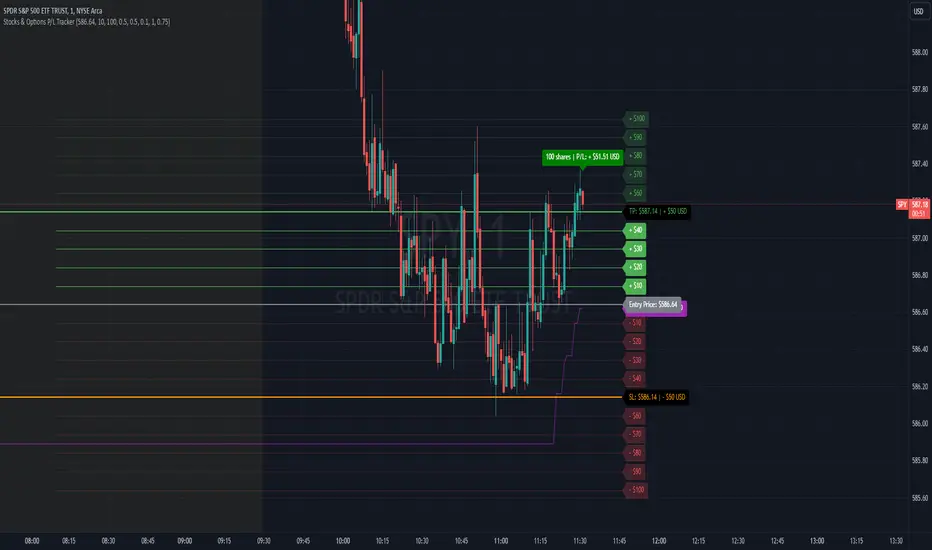
The Stocks & Options P/L Tracker is a custom TradingView indicator developed to offer traders precise tracking of stocks & options trades’ profit and loss in real-time. It features a detailed display of P/L intervals, stop-loss and take-profit levels, and an adaptable trailing stop mechanism to help traders manage risk and optimize their trading strategies. This tool is particularly useful for active traders who seek immediate visual feedback on their trades’ performance.
Key Features:
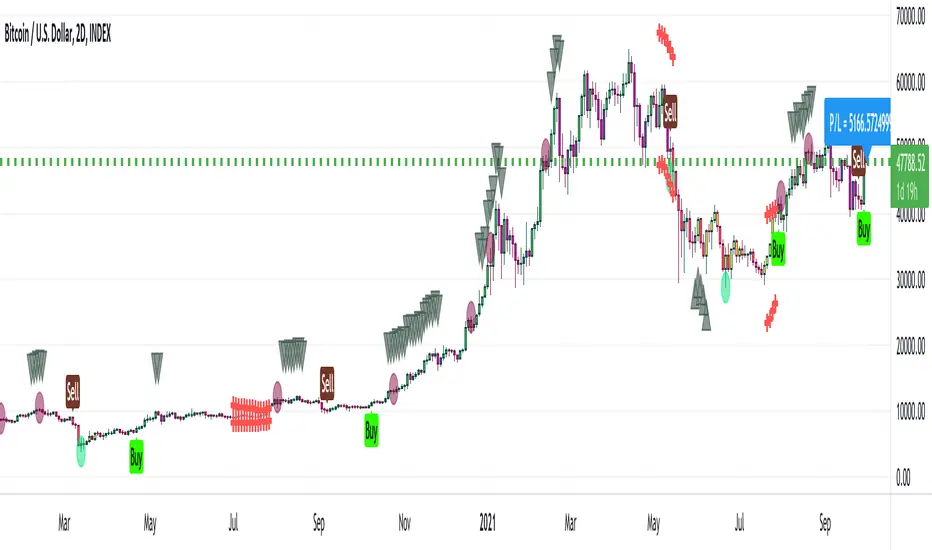
Real-Time P/L Display: Computes and displays the P/L per contract/share and total P/L dynamically on the chart based on the specified entry price, relative to the current market price, and number of contracts or shares.
Configurable Take Profit and Stop Loss: Users can set take-profit and stop-loss amounts, and the indicator will visually mark these levels with corresponding dollar amounts for easy reference.
Trailing Stop Functionality: Offers an option to enable a trailing stop that automatically adjusts based on price movements.
Interval-Based P/L Tracking: Uses customizable intervals to display projected P/L levels above and below the entry price, helping users understand potential profit or loss scenarios at a glance.
Dynamic Labeling and Alerts: Visual labels are used to mark P/L, take-profit, stop-loss, trailing stop, and entry levels. These labels update dynamically on each new price bar to provide immediate insights into trade performance. NOTE: Due to TradingView's limitations with server-side alerts on fixed prices, dynamic alerts (for Take Profit, Stop Loss, and Trailing Stop) that adjust with price changes are not yet available. Alerts must be manually reset to your desired price each time.
Clean and Responsive Design: Utilizes color-coded labels and lines for P/L intervals, making it easy to distinguish profit, loss, stop, and take-profit zones. Colors adjust automatically to the current price to maintain clarity.
User Input Validation: Ensures appropriate input values for items like entry price, contract/share size, and profit/loss intervals to prevent errors and optimize performance.
Efficient Object Management: Implements object reusability for lines and labels to stay within Pine Script's object limits, ensuring smooth operation and maximum accuracy in real-time tracking.
Automatic Adjustments Based on Market Changes: Calculates and adjusts trailing stop levels dynamically based on highest price movement, which provides traders flexibility while maintaining risk controls.
Trader Benefits:
This indicator empowers traders with a robust tool to manage their trades visually and strategically on TradingView. The real-time feedback and customization options help traders make informed decisions, minimize risks, and maximize potential profits.
Happy Trading! :)
Indicatore Pine Script®